


Business growth hinges on three seemingly basic and easy questions. What, Why, and How. And if we answer all of these, it’s a beautiful flow that allows us to make the best decisions and grow.
Read the transcript below to learn how marketers can get straight to the why behind their KPIs.
Most marketers have a decent grasp of what’s happening in our business as we measure progress using metrics and KPIs. We can all build some pretty sophisticated dashboards that alert us the moment our KPI is outside of a threshold. And if you don’t have those sophisticated dashboards, you might have a crazy Excel workbook (it’s basically a work of art). I’ve even heard people that have 50 tabs of Google Analytics open at any time to monitor the status.
But, then a KPI starts going the wrong direction, maybe our web conversions are going down. It’s usually not a dramatic drop but something we see falling slowly until one day, it lands on some executive’s desk and now it’s a fire.
So what do we do? Typically we jump straight to the how; run a free shipping promotion, offer discount codes in a new email campaign, etc. Then the executive team says, “I need data on this” or “what does the data say?” And that gives all of us heart palpitations.
It’s hard to figure out the why behind your metrics or prove that your how tactic will work. I’ve heard of war rooms being created to find the problem, I’ve worked with thousands of analysts that burned the midnight oil to find anything, and I mean ANYTHING that they could throw into that PowerPoint presentation. We start slicing those dashboards like a Michelin star chef but we often end up following rabbit trails and reluctantly find ourselves grasping at straws.
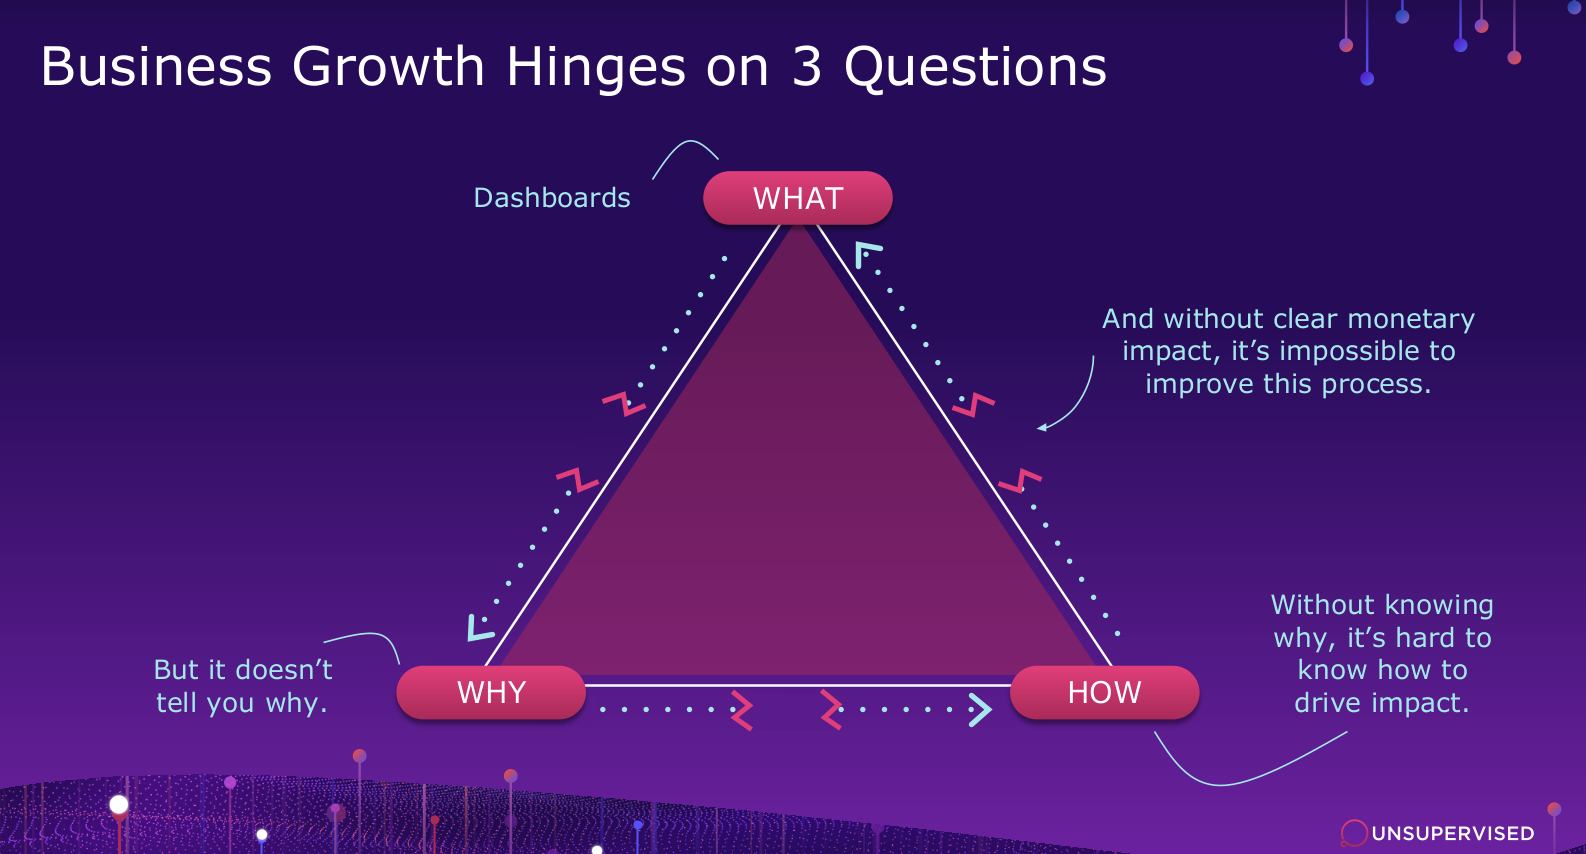
We end up in a vicious broken cycle that is impossible to grow our business. Yet, what do we continue to hear: “We need more dashboards” or “can we watch this on a dashboard?” But by focusing on the dashboard, we are only going to see the tip of the iceberg.
Finding the Why Behind a KPI
About 10 years ago, I was given the ownership of analytics for our region in a global CPG company. At the time, there were no dashboards or at least nothing the satellite offices had access to. Instead, a monstrosity of a workbook was passed around and before I had the project, a person was literally writing down the numbers and typing them into an email each week.
So, I took that enormous excel spreadsheet and combined it with Nielsen data, and created these sweet thermometer charts that would update automatically. I mean I thought I was the “bee’s knees” and the company was impressed too.
That was 10 years ago. Why do I bring that up? Because I think the same thing is going to happen in 10 years as we look at the why. We are going to look back and say “wow, remember when you wanted to know why a KPI was moving up or down? We used to basically perform digital CSI to get there.” Today, finding the why can be so much easier by leveraging the right AI.
So let’s look closer at how we get to why today. You’re in this executive meeting, and website conversion is down. There are likely many reasons for this so executives start asking why it’s down. Conversions are down – why? Cart abandonment rate is up – why? AOV is down 12% month over month and 17% from last year – why?
The logical next step is to jump into the dashboard and follow the signals. Maybe we see a number that looks out of the ordinary, so we follow that signal. Maybe we continue to try and squeeze out something interesting. Most likely we end up in a spreadsheet of data, and if we’re here, we’re screwed. We are back looking at raw data. More often than not, we’re going down many rabbit trails like this, following the signals.
At the end of the day, it’s like trying to find Waldo. If you’re familiar with “Where’s Waldo”, finding the why behind your metrics is similar to hunting for Waldo in a sea of seemingly similar items. You know what you were looking for, but it’s hard. Sometimes, you get lucky and spot Waldo right off the bat. Sometimes you’d spend hours trying to find his key or camera. I even knew people that had extensive Waldo methodologies in covering every square inch but they’d still miss some of the items after several passes. That’s because we’re human. If we find one of the items, but not all of them at the same time, then we are missing key parts of the story.

The why should give us more specifics to help us know where to focus. It doesn’t tell us how to fix the business, it may not be something we can act on but it’s like a cheat code. I need to see why my conversions are going down or what drives it up in order to lean into that. For example, knowing what channel or traffic source, what campaign, what audience, customer segment, or time. Combining all this information in order to see what really drives our metrics is the key.
In the “Where’s Waldo” example, it tells me where to focus. That’s the power of why. So how do we get a better why? Well, looking at those dashboards has a long process behind it. Just like 10 years ago when I was building thermometer charts, we are all going to look at this process and laugh.
We often don’t use all the data we could because of the dreaded prep process. Cleansing and joining the data is like performing analytics gymnastics in the Olympics of analytics. We often remove text data because no one has time to deal with that. And we remove columns of data because our data is too big or it seems like noise. Then we spend a lot of time trying to find the why.
All of that leads to the execution of our how strategy, tactics, and hopefully ROI. Unfortunately, less than 30% of us get ANY outcomes from our data. Yet we still call ourselves data-driven.
The problem with this process is that the beginning is compute-intensive and we have humans doing this part and we’re not great at that. It takes a really long time. Just like when my old colleague would write down the numbers. Not to mention there is a huge opportunity for human error. But most importantly we unintentionally introduce bias by eliminating some data. While that may seem meaningless right now, it can have a big impact later down the line, and at that point, it’s too late.
If we don’t start to look to solve this now our ship will be severely off course. So, we have this data that we then use to help us execute our strategy with AI. Fortunately, unsupervised machine learning and AI have emerged to change the way we approach data analysis. AI can handle more data, plain and simple. It can expand data through feature generation in ways we couldn’t dream of. The power of using unsupervised AI instead of supervised machine learning can truly change how we look at data.
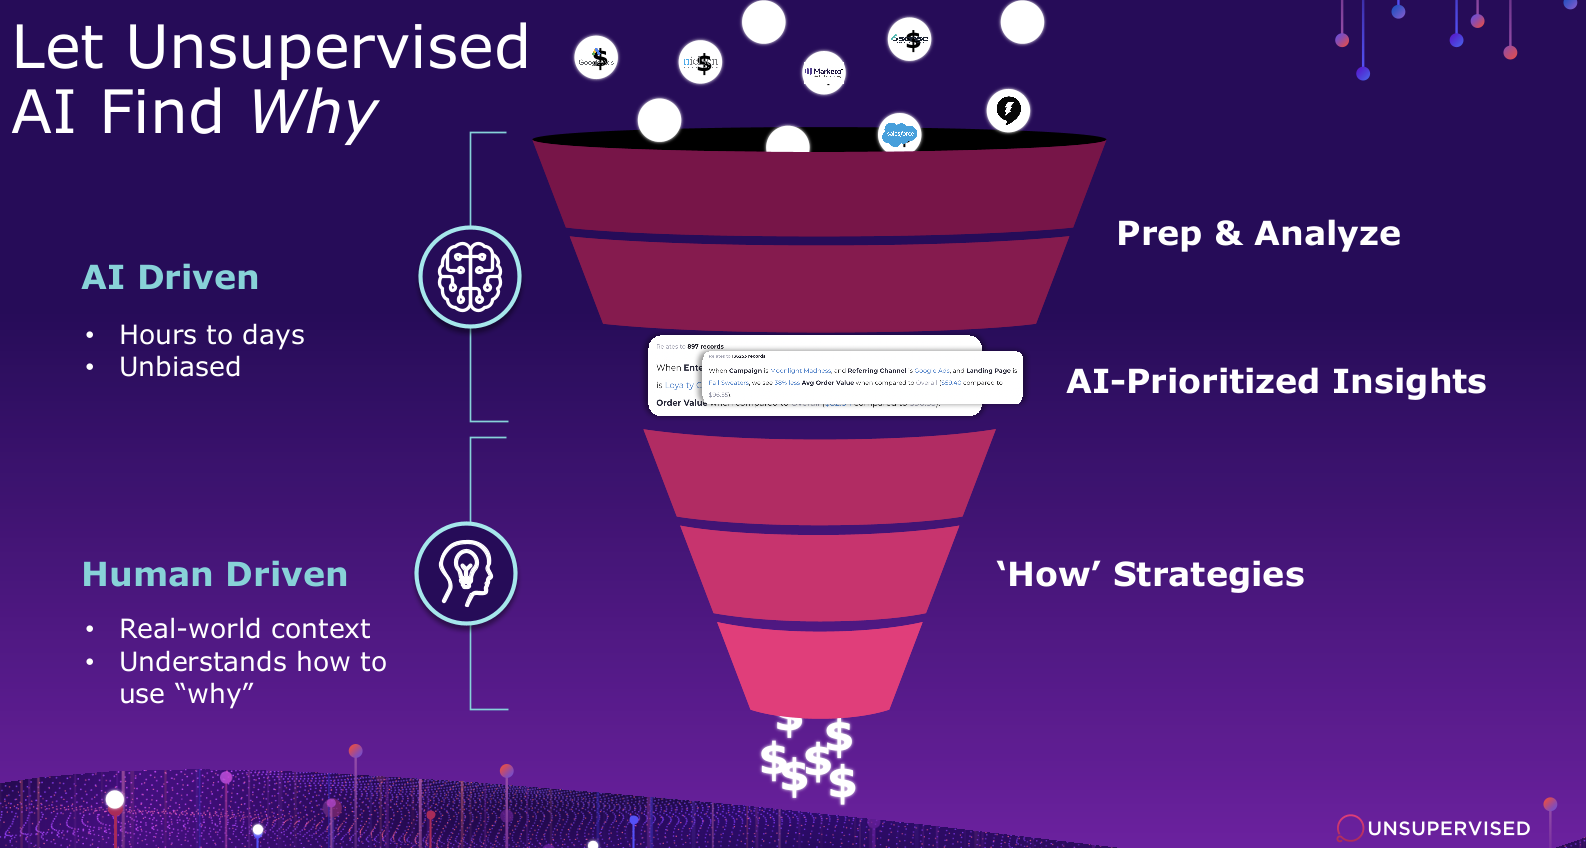
Unsupervised AI removes bias and gives humans insights that have been prioritized based on the impact on a KPI. Now, we’re able to actually do something with this information. Unsupervised AI provides us with answers to questions we never thought to ask.
I know, we’ve heard this all before. The promise of data. The promise of AI. But most AI today leverages supervised learning which doesn’t allow the data to tell us the story. Unsupervised machine learning allows data to tell you the story because we aren’t telling the AI what to find. This very seemingly minor difference is where the power of AI can truly come from.
Automated Analytics with Unsupervised
Let’s take a look at a real example, Charlotte’s Web is an industry-leading pioneer in creating whole-plant hemp health supplements. Now, eCommerce is a hyper-competitive space, and CBD markets are on fire right now. Charlotte’s Web owns their supply chain to manufacture their products but they see the biggest competitor in their space being the eCommerce route. How do you compete against the likes of Amazon?
Charlotte’s Web saw that data could be their competitive advantage. Amazon has massive amounts of data armies as opposed to Charlotte’s Web’s team of 3 people. To say they were an underdog is putting it lightly. They don’t just sell one product. They have a vast number of products, subscriptions, and packaging options for their customers. The data was super-complex; URL strings, time stamps, text data, you name it they have it.
So like many of you, they have web, customer, and transactional data. One that is particularly tricky is web data, to understand the movement of customers. Where do customers land on the site, where do they go, which route is most successful, what do people buy, how long do they stay on specific pages?
Charlotte’s Web had over 40 million rows of data, 17 tables, and over 1200 columns. Stitching this data together can take a long time, in fact, it was taking them months. Unsupervised AI was able to do this in hours.
As mentioned earlier, unsupervised machine learning is unique because it allows the data to tell you the story and in doing so, it starts to create additional columns of data between things that look interesting. The AI took all that data and expanded it further by over 400%.
For example, the Charlotte’s Web data didn’t have a column of data called “first-page name” that a human had to go create. No one was specifically looking for “first-page name”. The AI tore apart the URL string and created a column of data for that.
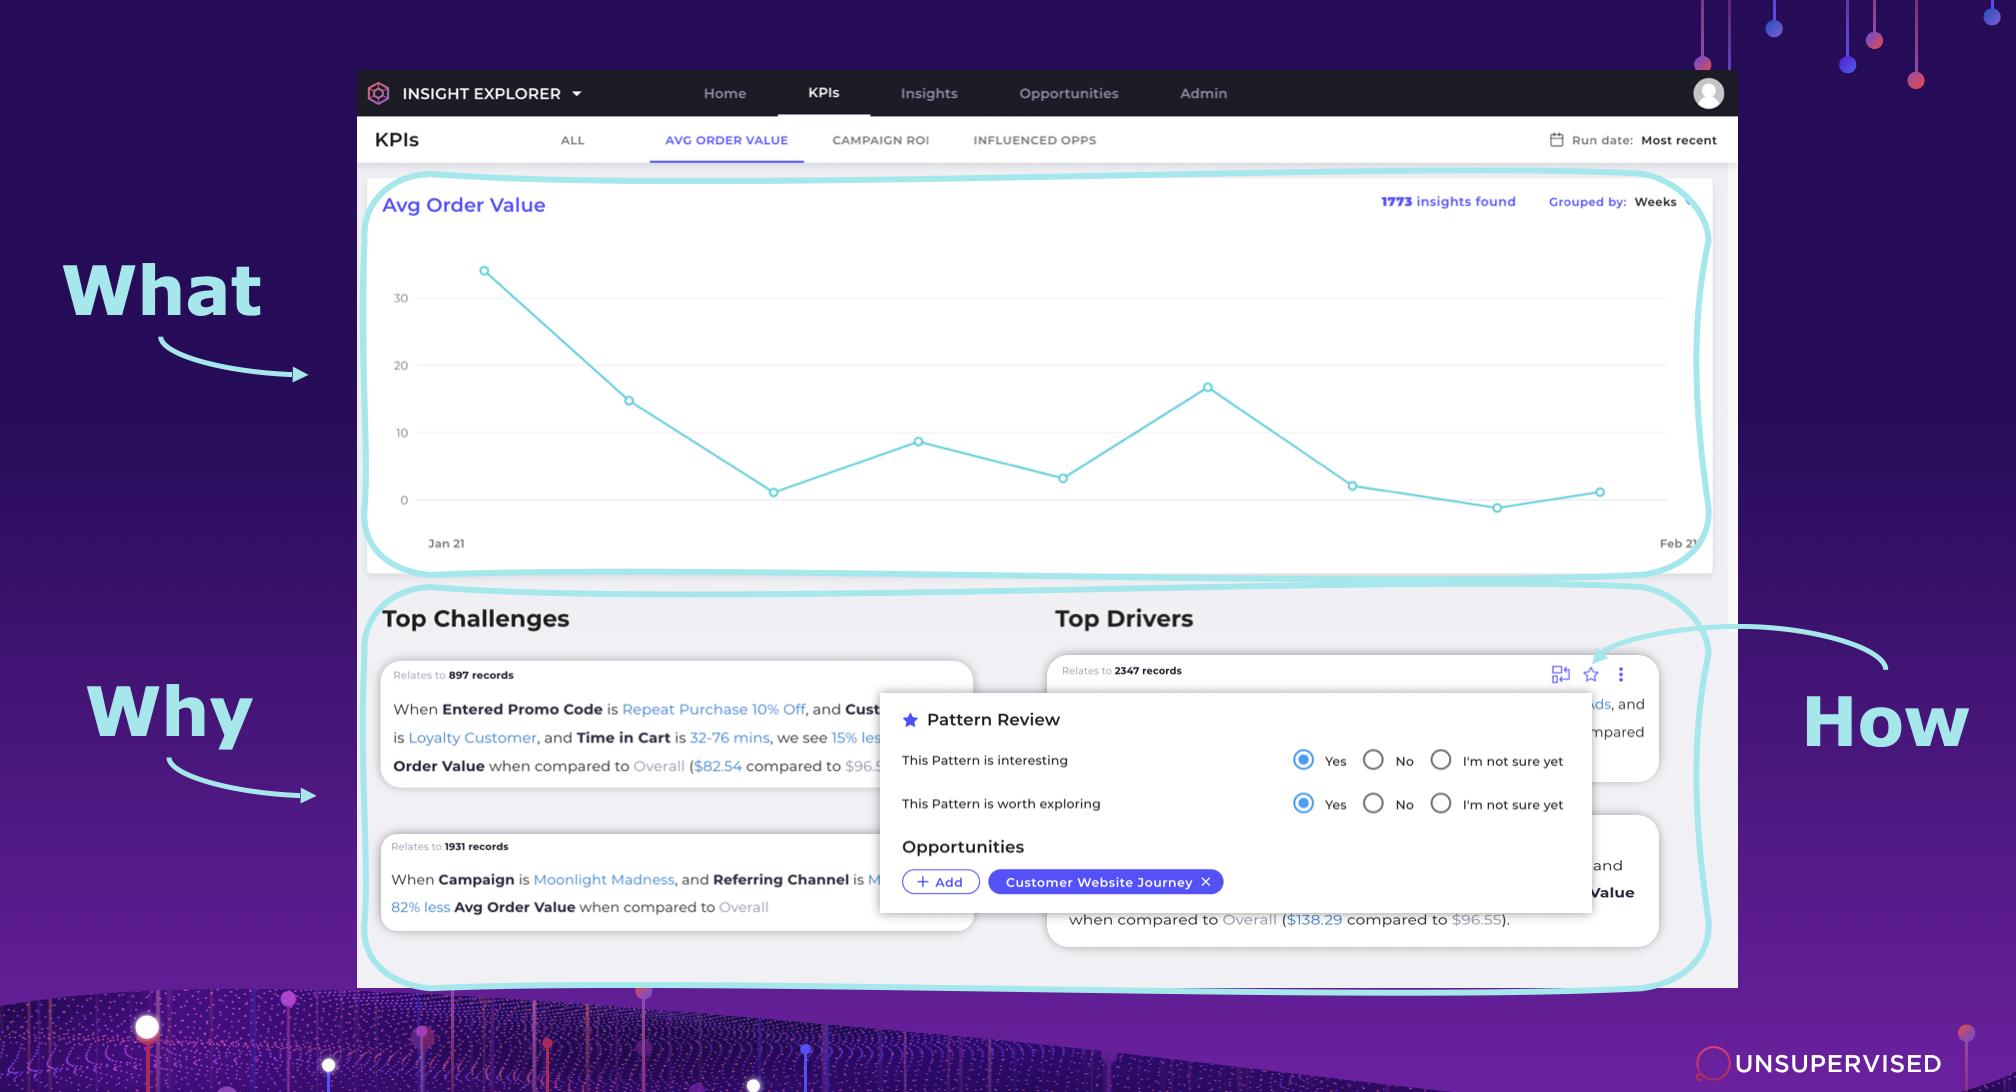
The marketing team was able to come in, see that the average order value was down, and immediately see the biggest drives and challenges. The AI prioritized those insights based on the impact on the KPI. Maybe something showed 90% less AOV but if it only accounted for 2 small customer sales, it wouldn’t show up as being a top priority. These insights are in natural language so that we can understand them, but we can always go explore additional ones or focus on specific areas that we can make an impact.
Once they found insights they turned them into opportunities. This is really important because it closes the loop of analytics and allows teams to really prove the value. A place where teams can collaborate and work together on initiatives. And the best part is that the insights are attached and updated so you can see how your progress is improving.
Charlottes Web is easily identifying what’s happening, why, and how they can fix it. This knowledge is allowing them to not only compete in the market but be a leader in a world of 9000-pound gorillas.
At the end of the day, dashboards aren’t enough. It’s time to skip the drill-downs and get straight understanding WHY. Ready to learn more? Schedule a time to speak with one of our experts today.