


American Businesses Are Relying On Data But Have Room to Grow

Key takeaways
- The average employee said their company was only using their data to 75% of its full potential.
- Almost one in three employees said their company had difficulty analyzing data and using it to make decisions.
- 95% of employees said their company had room for improvement in their implementation of KPIs.
Data: it’s a blessing and curse to most businesses. You’ve probably heard the saying in business circles, “There are lies, dang lies, and then there are statistics.”
Regardless of how you feel about the endless mountain of data we absorb, numbers and the meaning behind them are critical to every business’s bottom line.
We surveyed professionals whose jobs involve wading through statistics to examine the role that meaningful data plays in a business context. How do these high-level number crunchers analyze numbers, and what insight can they offer on producing the correct data at the right time?
Businesses’ New Language
Perhaps the best way to think about data is viewing it like another language. When compiled in a logical and organized manner, data lets us quickly interpret vital information. That’s why many senior executives and small business owners want to see the numbers before reading explanations and notes. Let’s start by considering the most frequently analyzed topics.
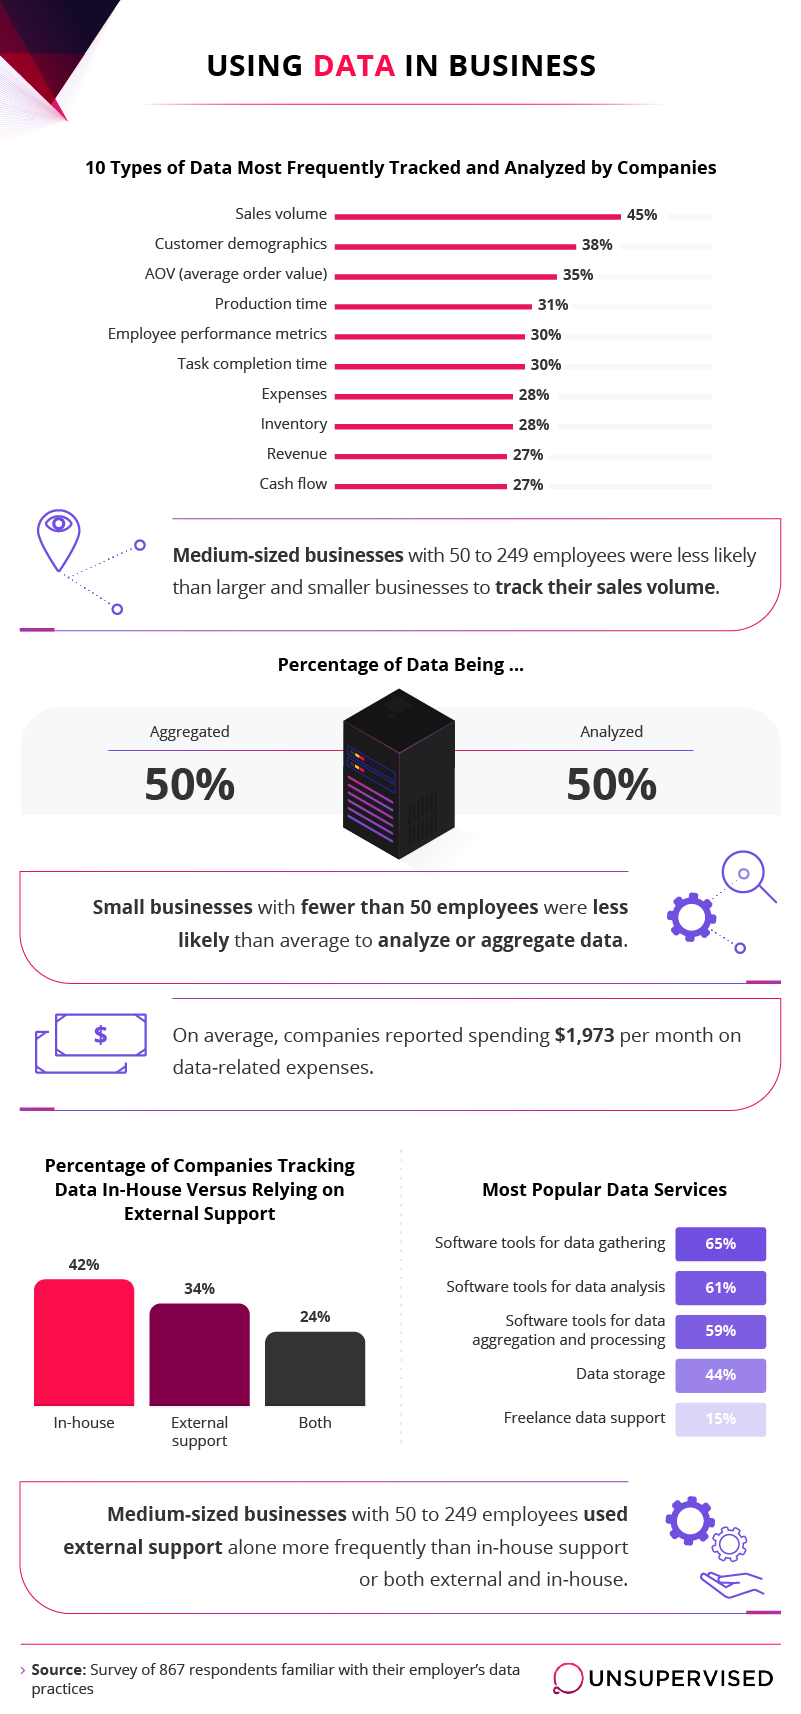
It is no surprise that tracking sales results topped the list, as analyzed by 45% of companies. Executives need to review their business revenue, so they know how much money is available for line items like salaries, new equipment, maintenance, or expansion.
For a company or organization, understanding your customers and end-users is vital. After all, knowing who’s using your product and why is part of a successful blueprint. That’s why 38% of respondents measured customer or donor demographics.
Looking at numbers is only the beginning of proper data management, though. Half of our respondents used aggregation – or the process of compiling data in an organized fashion – to gain further insights. The remaining half analyzed the numbers outright.
Companies and organizations are increasingly contracting with outside sources for many tasks, ranging from accounting to sales, marketing, and creative services. When it came to data management, 42% of respondents tracked data internally, while 34% relied on external support. Another 24% used a combination of internal and external sources to manage this task.
There’s also a digital platform for virtually any business task, including data management. Almost one-third (65%) used a software program to gather data, and 61% used similar software programs to analyze what they had collected.
We Have Data, Now What?
We’ve touched on some of the ways companies gather data. However, what they do with that information is what really counts.
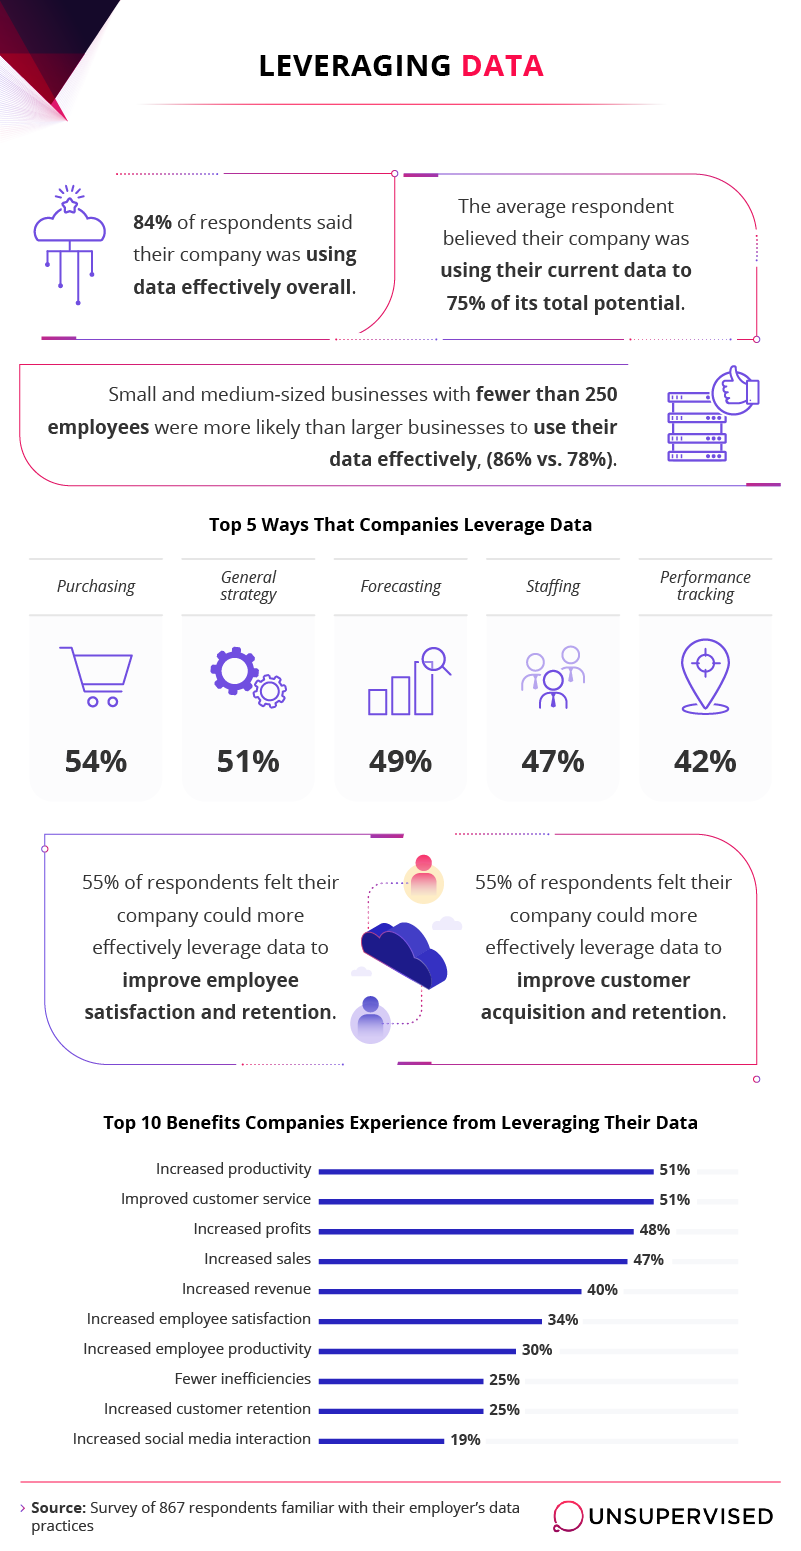
On average, respondents felt companies were reaching 75% of their potential when it came to collecting and analyzing data. Another 84% claimed their companies used data effectively overall.
Of the top five ways in which companies leveraged data, purchasing and general strategy led the way at 54% and 51%, respectively. Forecasting (49%) and staffing (47%) followed closely behind.
When you boil everything down, customer and employee retention were the primary reasons why companies leveraged their data. On the receiving end, over half (55%) of respondents admitted their companies could improve in both areas.
Many technology CEOs agree that retaining and acquiring customers is one of the most significant benefits of investing in data analytics. At the same time, they say that while most companies have been collecting data for long periods, it’s actually “dirty data” in many cases, meaning it’s unstructured and therefore requires additional processing or specialized tools for analysis.
That being said, only 25% of respondents in this survey claimed they noticed an increase in customer retention. In comparison, 19% felt effective data management increased social media interaction.
Respondents also believed their company benefited from increased profits (48%), sales (47%), and revenue (40%) by effectively using collected data.
Using Data Wisely
Collecting data is one thing, but using it effectively is what counts. Respondents pointed out multiple areas where their companies struggled to interpret and understand what they had aggregated.
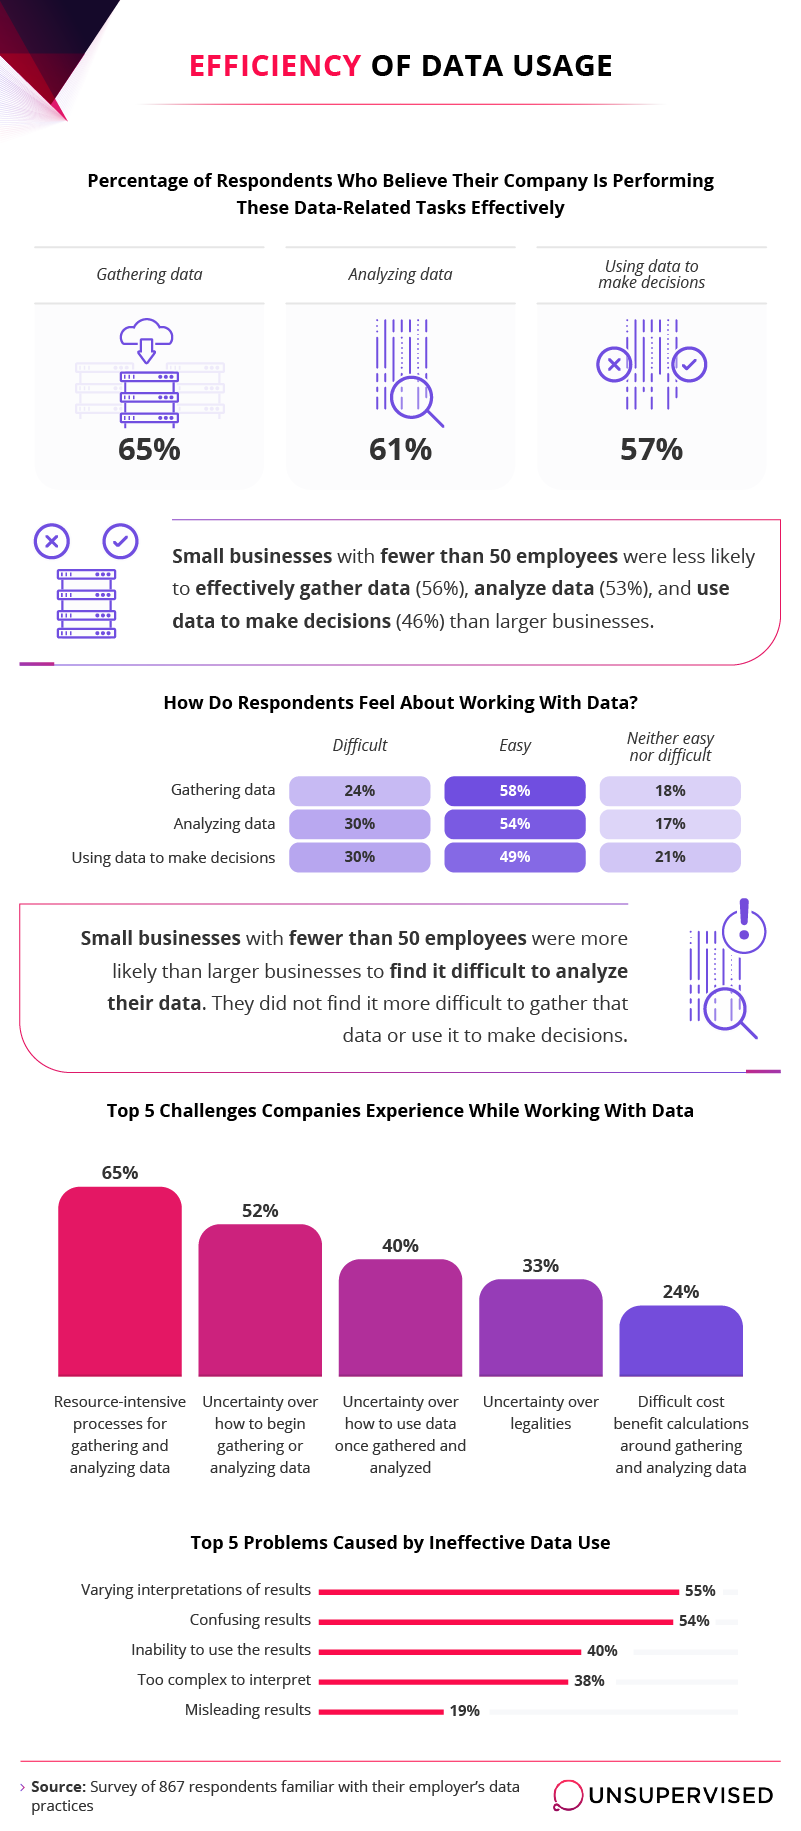
On the positive side, 65% of respondents believed they were effectively gathering data, with 61% saying as much for analyzing what they collected. The challenge for 30% of respondents involved the analysis and interpretation of gathered information.
Two significant challenges were high resource requirements (65%) and the uncertainty surrounding how to start the summarization process (52%) of collected data.
One-third felt that wading through the legal uncertainty of data collected posed an issue. Almost one-quarter admitted that justifying the cost gave them second thoughts.
Additional challenges often arose after data had been collected and summarized. More than half – at 55% and 54% respectively – said varying interpretations and confusing results overall were difficult to navigate. The confusion around ineffective collection efforts presented additional problems.
Business consultants echo these concerns, with one advisor stating, “The biggest challenge companies face is the inability to implement actionable insights based on analytics.”
Another 19% of respondents were concerned about the misleading results of poorly summarized statistics.
Unlocking Data With a New Key
Of the many acronyms used in business circles, Key Performance Indicators (KPIs) are, well, key. Establishing and tracking them gives businesses a snapshot of how different areas of interest are performing at any given time.
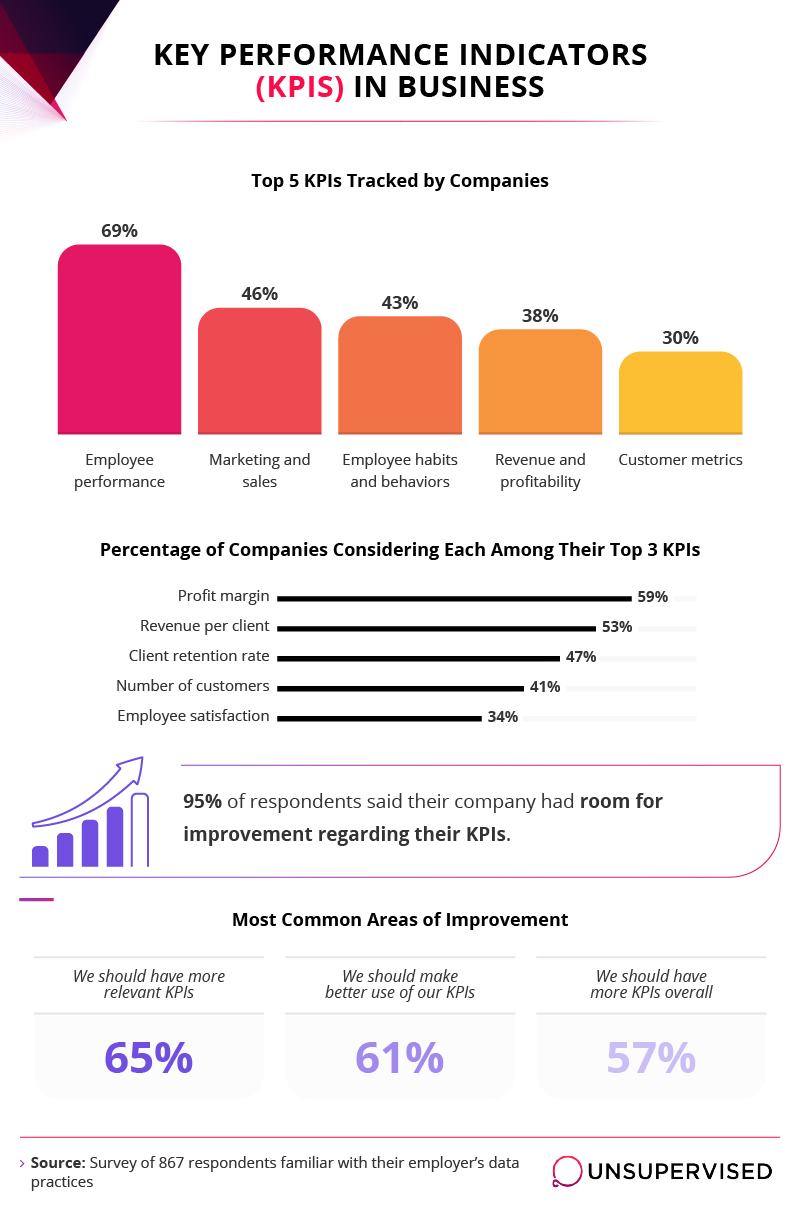
Over two-thirds (69%) of respondents ranked employee performance as a top KPI, while just 46% said marketing and sales results should fall into this category. Only 30% tracked customer metrics as a KPI, with revenue and profitability coming in at 38%.
Deciding which areas are most vital for implementing a KPI strategy can depend on business objectives or sector. Profit margin, revenue per client, and customer retention rate were the most popular metrics our respondents measured using performance indicators.
Over two-thirds (69%) ranked employee performance as a top KPI. Surprisingly, only 46% said marketing and sales results fell into this category. Only 30% tracked customer metrics via KPI, with revenue and profitability coming in at 38%.
One thing that practically every respondent mentioned was having room to improve KPI strategies. Increasing the number of KPIs was mentioned by 62% of those surveyed, with 55% hoping to make better use of existing indicators.
Measuring employee satisfaction through KPIs is a widely used approach by companies. The one challenge is that objective data can’t measure morale and other subjective areas that impact worker attitudes and how they affect production.
The Final Analysis
It would be tough to argue that data isn’t an integral part of managing a successful operation. Yes, many may have a love-hate relationship with data collection, but the overwhelming consensus proves consistent data collection helps companies acquire and retain satisfied customers and employees.
Methodology and Limitations
For this study, we surveyed 867 full-time employees with knowledge of how their company gathered, analyzed, or otherwise worked with data. Among those respondents, 537 were male, 329 were female, and 1 identified as non-binary. Our respondents ranged in age from 18 to 89 with an average age of approximately 38.
In some cases, questions and answers have been paraphrased or rephrased for clarity. To help ensure accurate responses, all respondents were required to identify and correctly answer an attention-check question. These data rely on self-reporting. Potential issues with self-reported data include selective memory, telescoping, and attribution errors.
Fair Use Statement
Most businesses don’t want to share their relevant data, but in this case, we invite you to distribute these results for any noncommercial use. Just give credit where it’s due by linking back to this page is our only request.