


Have you ever found yourself reviewing the key marketing metrics for your organization, as you’ve done dozens of times, but this time you have a hunch to dig just a little deeper? Maybe you’ve had conversations with folks on the Sales and Customer Support teams telling you that they aren’t seeing the same results you keep reporting on. Anecdotally, their teams are getting annoyed with all the celebration of success, yet their prospects and customers aren’t satisfied, and neither are they! Well, you may be about to discover you have a sample size problem —and not a small one!
In fact, you are about to see that you’ve been hiding your most valuable metrics behind a camouflaged cloak of consolidation. An aggregate of egregiousness that shrouds your insights so much it requires a private investigator, “Edward H. Simpson, P.I. is on the case”!
In reality, you weren’t trying to cover up some big conspiracy and Edward wasn’t a P.I. Edward H. Simpson was a statistician and codebreaker at Bletchley Park, known for breaking the secret communications of the Axis Powers during WWII. After the war, he wrote a paper called “The Interpretation of Interaction in Contingency Tables” which explained the care data analysts need to take when interpreting data. This became known as the Yule-Simpson effect or Simpson’s paradox.
What is Simpson’s Paradox?
Simpson’s Paradox is a phenomenon in probability and statistics in which a trend appears in several groups of data but disappears or reverses when the groups are combined. Essentially, when we review data sets, we notice trends that are comprised of the overall dataset, but those trends may not exist or are opposite of what is occurring within our smaller segments of data.
The ultimate example of this paradox is a UC Berkeley study of gender bias among its graduate program admissions in 1973. Nearly every article you will read on this topic cites this study as the prototypical example for “not digging into the data”. Below is the admissions data for UC Berkeley graduate programs in the fall of 1973. Clearly, we can see that men were admitted at a significantly higher rate than women across all departments.
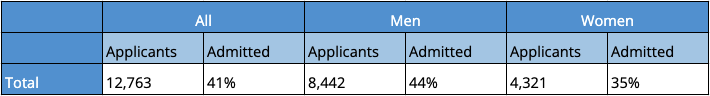
Alas, let’s look deeper. Let’s review the data from the 6 largest departments at that time and see what comes to light. Drum roll please!
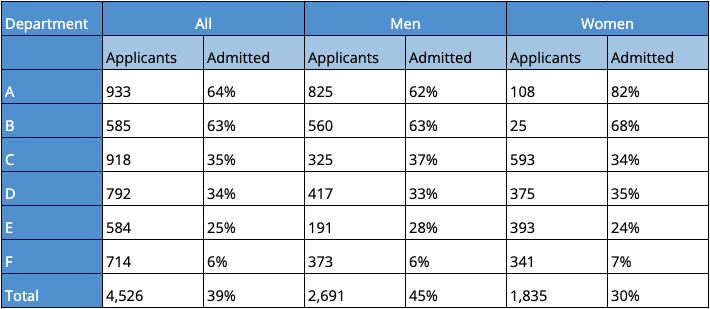
Ahhh… here we are, it’s all coming together now! A few patterns have emerged that paint a very different picture than the one we began with. Now we find, despite the overall showing clear bias towards men, we have individual departments that are favoring women. What the University learned through Bickle’s research paper was women tended to apply to departments, such as the English department, which had lower rates of admission to begin with as they are more competitive. Men on the other hand, spent their time pursuing less competitive degrees like Engineering (from an admissions perspective — we love engineers!).
This same problem exists across all matters of data. This is why we disagree with polls and surveys about the best place to get a burger downtown. Or why we debate which quarterbacks are better at escaping pressure. Or why political pollsters seem to be off every year! Or even why the Sales and Customer Support teams continue to harp on you about “fake news” conversion rates. Speaking of, let’s revisit our embattled Marketer.
How Simpson’s Paradox Applies to Marketing
After reading this article, you, our widely successful yet under siege Marketer, are now digging deeper into the data on marketing funnel conversion. You have decided to segment your conversion by and low and behold: Eureka! We see that conversions from the West Coast aren’t converting nearly as well as those on the East Coast. Additionally, we can see that re-orders are wildly outperforming in the Southeastern part of the country. We cracked the code! (Well, almost…)
The final piece of this puzzle is for us to gain a better understanding of the “Why”. Why are under or over-achieving within these segments? We need something that will give us characteristics to flesh out the root cause. Is it that we are leveraging different marketing materials in different regions? Do we need to simplify or update our messaging to fit different audiences? Should we be allocating marketing budget differently for the West Coast?
Simpson’s Paradox is an issue many businesses face on a daily basis, which is why it’s so important to have tools in place that help you find insights that can truly make an impact. Unsupervised gives analytics experts and business users the tools they need to understand, prioritize, and take action upon their data all within a single platform. Give Unsupervised a try today, click here to take our product tour.